
ROBO-HI Technology
Start exploring ↓
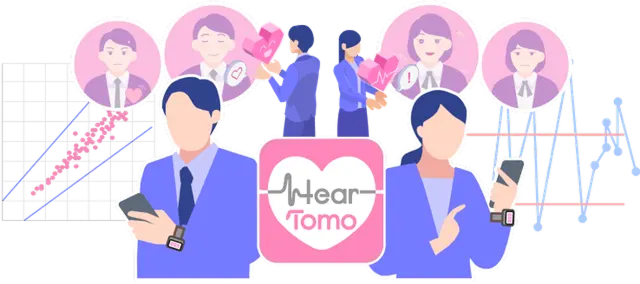
Heart-rate data captured by the Apple Watch ECG is analysed and visualised using the slope of 1/f fluctuation and its time series.
It also performs emotion analysis and takes context into account — at home or at work — so you can read states such as relaxation or focus.
In nature, 1/f fluctuation appears everywhere: in the wavelengths of light, in music (Mozart and singers alike), in electrical signals, butterflies, fish, wind, sunlight filtering through leaves, the sound of a stream, and flames.
Our heartbeat follows the same 1/f fluctuation day to day. Taking regular Apple Watch readings in the morning, at midday and in the evening therefore makes the analysis far more meaningful.

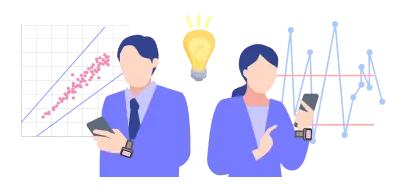
By reviewing the slope of 1/f fluctuation and the Lorenz plot from daily measurements, and by following real-time and resting heart rate through figures and graphs, you come to feel the work of your heart up close.
And by watching those figures and graphs change, you build a habit of paying attention to your own health — this is what is known as biofeedback, and it is recognised as an effective approach to self-care.
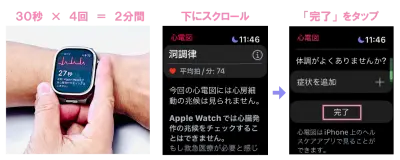
To improve analytical accuracy, aim for a clean heart-rate waveform.
Rest your arm on a table or your knee and keep your finger still for 30 seconds. After scrolling down to the result and tapping "Done", take another 30-second measurement.
Four measurements in total are needed to gather two minutes of data — which makes HearTomo roughly four times as accurate as apps that rely on a single 30-second reading.
Try to take the four measurements back to back, without long gaps in between.
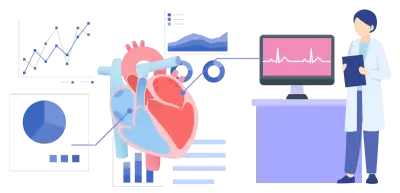
Built on a heart-rate data analysis server system (patent 6430729) developed through joint research between Motohisa Osaka — a graduate of the Faculty of Mathematics at the University of Tokyo and of the Nippon Medical School, now Professor Emeritus at the Nippon Institute of Life Sciences — and ZMP.
Osaka carried out heart-rate fluctuation analysis using a proprietary formula together with the spectral analysis algorithm developed by Professor Ronald Berger at Johns Hopkins Hospital.

1/f fluctuation
Slope and
trend

Lorenz
Plot

On-demand
ordering
Emotion prediction

Heart-rate trend
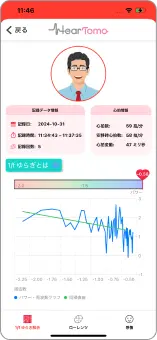
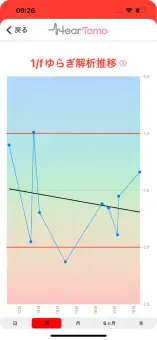
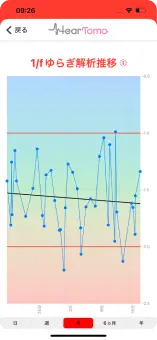
RRI heart-beat interval data is converted to PSD (power spectral density) and BPM (beats per minute) is calculated using FFT (fast Fourier transform) to derive the 1/f fluctuation.
We then compute the slope of that 1/f fluctuation, with log10 of PSD on the vertical axis and log10 of PSD frequency on the horizontal axis.
A value of -1 is the state in which many cyclic components blend together "just right"; in natural phenomena such as the fluctuation of wind or sound, that state is experienced as pleasant.
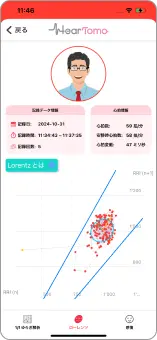
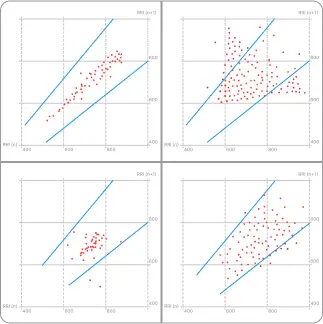
One time-domain indicator of autonomic nervous activity is the heart-beat interval RRI(n), defined as the interval between the nth beat and the one before it.
The Lorenz plot is produced by plotting RRI(n) on the x-axis against RRI(n+1) on the y-axis.
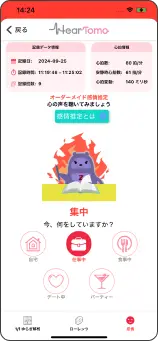
The system learns and updates daily from accumulated data, producing emotion predictions tailored to each individual.
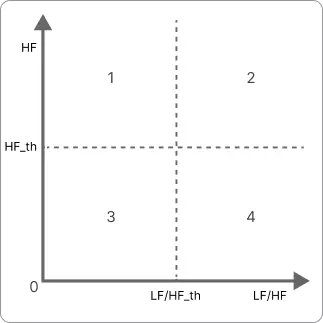
The power value obtained from heart-rate variability spectral analysis, integrated over the 0.04–0.15Hz band, is LF (low frequency) and mainly reflects sympathetic nervous activity. The value integrated over the 0.15–0.4Hz band is HF (high frequency) and reflects parasympathetic activity.
Sympathetic and parasympathetic activity is classified into four states: "both high", "sympathetic only high", "parasympathetic only high" and "both low". Emotion prediction is delivered as a "voice of the mind".
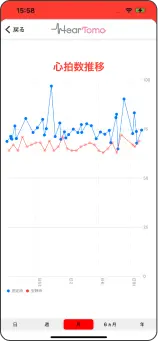
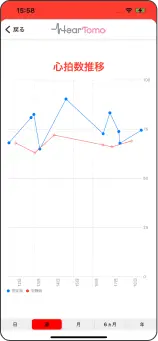
The red line is resting heart rate; the blue line is heart rate measured with HearTomo.